
Project 1
DHM280
Kane Deiley, Austin Miller, Morgan Bailey, Abby Spavlik, Aidan Homung, Chris Petragnani, Mike Waltrich
Context & Project Overview
Through this project, our goal is to relate digital humanities to the discipline of Computer Science through a project and a tool of the digital humanities. We will also assess the values of Computer Science and compare them to the values of digital humanities. We have created this project because it is a requirement for our DHM280 Intro to Digital Humanities course to assess the relationship between digital humanities and Computer Science.

Overview & Discipline
Computer science is the study of computation, automation, and information. It combines the principles of engineering, mathematics, and science to study hardware, software, algorithms, how humans interact with technology, and much more.

Computer scientists study these things through the creation of custom software, by modifying and repurposing existing software packages, and by designing and building custom hardware solutions for problems in the field. They deal with designing and analyzing algorithms that can solve problems. One of computer science’s main concerns is discovering what can and cannot be automated.
Computer Science has many research fields including Artificial intelligence in healthcare and machine learning, communication systems, computer architecture, Human-computer interaction, programming languages and software engineering, robotics, and internet security. Often, CS researchers work with researchers in other fields by offering computational analysis, simulation, or other automated research methods for problems in other fields. Often these collaborations allow computer science to impact human culture. An example of this is computer scientists making data visualizations accessible to people who are blind or have low vision. Some people can’t access certain information because of some sort of physical impairment or disability and computer scientists can help overcome those issues through their studies and work with other researchers.
Digital Project: Voxlens
The Project Voxlens was created in April of 2022 and spearheaded by five graduate students from the University of Washington spanning multiple University programs. The goal of the project is to improve the accessibility of online data visualizations for screen readers. The project webpage describes Voxlens as an open-source JavaScript plugin which utilizes libraries to enable the screen reader user to obtain a holistic summary of presented information, plays a sonic versions of the data and allows interaction with visuals in a “drill-down” manner using voice activated commands. The project not only aims to save time for the screen readers, but reduces the burden on visualization creators, who only need to write a single line of JavaScript code during creation for a holistic and multi modal relay of their data.
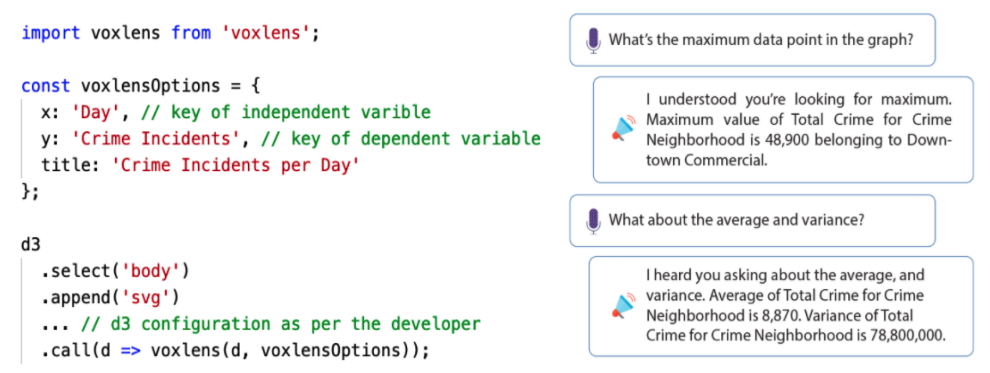
portray an example interaction with VoxLens using voice-activated commands for screen-reader users.
Multi Modal and Holistic refer to the project’s ability to have multiple ways of communication to describe their visualizations in entirety. Some modes include Q&A: where the user verbally interacts with the visualization & summary mode, where Voxlens verbally offers a summary of the visualization. Some of the aforementioned libraries that rely on developers to append appropriate alternative text (e.g., D3 and ChartJS); and (2) libraries that automatically provide screen-reader users with built-in features for data access (e.g., Google Charts). To learn more about the modes and libraries Voxlens uses, you can visit their GitHub project site.
Digital Tools: Chart.js

Chart.js is a free, open-source JavaScript library that presents a user-sided experience for creating HTML-based data visualizations through a browser. The digital tool allows users to manipulate data into a multitude of various charts, graphs, and scales in a flexible manner. As opposed to some similar tools. Chart.js provides a selection of ready-to-go charts which can be styled and configured at the client’s touch whereas others offer building blocks that must be constructed into visuals. This is capable due to the use of the HTML5 canvas element, which provides the base for the large number of different charts available. Chart.js works to create an easy-to-use, client-friendly outline for those searching for a customizable product with a large library of data visualization templates.
Values of Computer Science
Values are a very important piece of how life and the world is apprehended. The values that digital humanities and our project share are those of accessibility and collaboration.
Accessibility is something that voxlens brings to life and values through their work. Accessibility is what helps to bring user experience to a new level. Being accessible to everyone and all is a basic principle of both DH and voxlens. Accessibility in computer science is basically the same thing as it is in voxlens. Focusing on creating a platform that is available to all people regardless of their disability or impairment. Voxlens specializes in the area of bringing aid to people who are visually impaired.

Collaboration between individuals is what helps to tie everything together and create a way for people to be able to comprehend the information without visually seeing it or maybe even hearing it. Collaboration allows for multiple perspectives to verbalize what they get out of something and give different angles for improvement and advances.
Goal of Computer Science
In the project VoxLens their goal is to have a JavaScript library that improves the accessibility of online data visualizations for screen-reader users. Basically what this is saying is, they want to publish something that improves users’ visualization of online data. This was done by VoxLens using a user-centered iterative design process, building on findings and recommendations from prior work. Allowing users to be provided a way for them to explore, examine, and extract information from online data visualization. The digital humanities goal of publishing and providing access to cultural data aligns with this project’s goal. Once they have analyzed their data using their critical thinking, mathematical, and problem solving skills they transform the data into a program. This project does just that by creating a JavaScript library, which they published providing screen-reader users with a comprehensive means of extracting information from online data visualizations. The goal shared within this project and digital humanities is an important goal, because by publishing their work they are helping others as they work within the Computer Science field.
The goal of Computer Science is to think logically, computationally, and creatively to solve problems. Computer science as a whole identifies and analyzes a problem, design a solution algorithm as a systematic way of processing the necessary information to produce the required output, and implement the solution as a computer program. This is completed by having data, analyzing it, and solving the problem.
Scholarship
“Making data visualization more accessible for blind and low-vision individuals”
“Data visualizations on the web are largely inaccessible for blind and low-vision individuals who use screen readers, an assistive technology that reads on-screen elements as text-to-speech. This excludes millions of people from the opportunity to probe and interpret insights that are often presented through charts, such as election results, health statistics, and economic indicators.
When a designer attempts to make a visualization accessible, best practices call for including a few sentences of text that describe the chart and a link to the underlying data table — a far cry from the rich reading experience available to sighted users.
An interdisciplinary team of researchers from MIT and elsewhere is striving to create screen-reader-friendly data visualizations that offer a similarly rich experience. They prototyped several visualization structures that provide text descriptions at varying levels of detail, enabling a screen-reader user to drill down from high-level data to more detailed information using just a few keystrokes.”
Evaluation & Conclusion

This project is a great connection of digital humanities that gives those who are vision impaired a better chance at learning and analyzing new data that would otherwise be difficult. Low- vision impaired individuals are burdened when it comes to reading and analyzing data and data charts alike. A project such as ares that works to give vision impaired individuals connects and intersects perfectly with the humanities while trying to better help and arm these individuals with better tools helping them gain and retain more data in easier ways. Users said that both prototypes better help them to more rapidly identify patterns in the data. Scrolling from a high level to deeper levels of information helped them gain insights more easily than when browsing the data table. This project is a great connection of digital humanities that gives those who are vision impaired a better chance at learning and analyzing new data that would otherwise be difficult.
Team & Context
I am Kane Deiley, I constructed the Project section, and produced the entirety of the WebPage.

I am Aidan Hornung, I am responsible for the conclusion of this webpage as well as the slide show.

I am Austin Miller, I wrote the discipline description, and worked on part of the slide show.

I am Morgan Bailey, I am responsible for the Report.

I am Chris Petragnani, I am responsible for the values of our project.

I am Abby Spavlik, I am responsible for the Goals of our project.

I am Mike Waltrich, I am responsible for the Tools of our project.

